Vagrant setup: refactoring

If you are using the Maposmatic Vagrant test setup, you may notice that its directory layout has changed a bit over the last days.

Aside from the elevation model related changes mentioned in the previous post, most change really just reorganized paths and changed directory and file names.

Some of the more notable changes beside the renames:

  • Style and overlay install scripts now no loner write out ocitysmap.cnf snippets, instead for each style setup .sh file there is now also an .ini file containing the ocitysmap.cnf style declaration block only. The ocitysmap-conf.sh script then creates a new ocitysmap.cnf file when run, by collecting all the .ini files from the styles and overlays sub directories, creating the available_styles: and available_overlays: lists from this, and concatenating all the .ini snippets to the end of the config file. As the config file is now re-created from scratch each time now this should be more robust than the previous approach.
  • The README.md file is more detailed now, including information on e.g. file system layout, adding new styles, or provisioning real servers …
  • The number of “red” lines shown during provisioning has been reduced as much as possible, and the remaining ones that can’t be avoided are listed in the README. Anything mentioned there can be considered OK, any other red lines should be considered a failure that someone should look into

Vagrant setup: hill shading and contour line setup

Originally the provisioning of the Vagrant test setup just installed hill shading and contour lines for a fixed area (parts of Germany).

From now on during provisioning the actual area covered by the imported OSM data file gets determined, then all the SRTM 90m zone files overlapping with the data bounding box are downloaded and processed to produce hill shading, relief, and contour lines data for the data area.

Depending on the size of your import datas bounding box this may slow down provisioning a bit, but on the pro side you get your actual data area covered instead of just a part of Germany you may not even be interested in.

Some recent bug fixes


Web frontend

  • Empty paper format choice for multi page layout
  • When going back the paper format tab did no longer show the [Next] button
  • When going all the way back and choosing a different map section or layout, the choice of possible paper formats would not be updated accordingly
  • When uploading a GPX or UMAP file with a non-ascii character, like e.g. “ö”, in its name the frontend ran into a conversion error causing a 503 error page

Rendering backend

  • The OSM Notes overlay fails to add its own index category if no indexeable items were found on the base map layer. Instead of failing hard the overlay is just disabled in such cases for now
  • Also in general a failure inside an overlay plugin will only terminate the processing of that overlay, and not of the complete map request
  • When requesting re-render of an old request that included uploaded GPX or UMAP files no longer available in the servers upload directory, the request will now still succeed, but will be missing the GPX or UMAP overlay data, instead of failing completely

Open rendering bugs

  • With large map areas, or when using the “Pencil” style, the render process will sometimes run out of memory. To prevent this from happening I would have to reduce the maximum map area substantially. Instead I consider adding a “soft” size limit that will show a warning in the web frontend when being exceeded. E.g. on more than 10x10km² a warning would be shown, and anything above 20x20km² would still be refused up front …
  • Sometimes the Mapnik renderer runs into a segmentation fault and crashes. There’s not much about that I’d be able to do about that. It seems to be related to large map sizes, too, but I need to track this down further yet …

Maxspeed overlay update

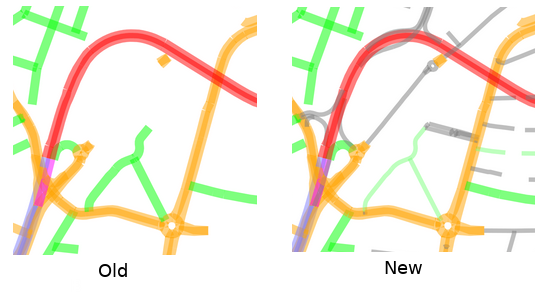
The MaxSpeed overlay now also shows streets with a speed limit of less than 30km/h, including “highway=living_street”, which usually don’t have an explicit “maxspeed” value set.

Such roads are now rendered in a lighter shade of green, and thinner lines.

Also road segments with no speed limit information at all are now marked with thin, gray lines.

PS: as the original ITO speed limit map has been discontinued, which I originally based the color scheme on, I may refactor the color scheme / color-to-speed mapping at some point

align=right

OSM Notes Overlay (experimental)

I added a new experimental “OSM Notes” overlay yesterday.

The Overlay will retrieve all active OSM notes for the displayed area, and will add numbered markers and index entries for each note.

This way it is possible to check a neighborhood for open notes without having to stare on a screen to get from one to the next, or at least that’s my personal intended purpose.

align=right align=right

Continue reading “OSM Notes Overlay (experimental)”

Umap GeoJson Export API Support

Upload of Umap files exported manually via the Umap web interface has been supported by my MapOSMatic instance for quite a while, and the MapOSMatic API has also supported submitting a Umap file via an URL instead of uploading an actual file.

There’s also a (so far inofficial) export URL for exporting an Umap for exporting a map directly, without manual browser interaction.

See this Umap Github issue for a more detailed description.

The basic idea is that for a map with Id 123 the stable web access URL would be:

https://umap.openstreetmap.fr/m/123

and the inofficial map export URL

https://umap.openstreetmap.de/en/map/123/geojson

Unfortunately the export file retrieved this URL is not yet complete though, as unlike the manualy exported file unsing “Export all data” in the web interface, it only contain the maps meta data, and references to the actual data layers, but not the actual layer data itself.

So when processing a file exported this way, we first need to check the “urls” dictionary from the map properties for the datalayer_view URL path, and combine this with the protocol and host part from the maps own export URL.

For the original Umap instance the datalayer_view looks like this:

/en/datalayer/{pk}/

and so the full URL template becomes

https://umap.openstreetmap.de/en/datalayer/{pk}/

The {pk} placeholder needs to be replaced with the Ids from the datalayers list entries, which e.g. look like this:

{
"name": "Layer 1",
"id": 123456,
"displayOnLoad": true
}

So we need to download actual layers data from URLs like

https://umap.openstreetmap.de/en/datalayer/123456/

which returns JSON data we need to append to the layers list to form a complete export file.

Once we fetched and merged all data layers we can then process the resulting JSON document the same way as the JSON exported from the web frontend.

This should allow a more direct integration between Umap and MapOSMatic servers, to automate the process of creating printed representations of maps generated with Umap.

An API request to render an umap with Id 123 would then simply look like this:

{
    "umap_url": "https://umap.openstreetmap.fr/en/map/123/geojson/"
}

In actual PHP code for example launching a map rendering job for this umap would look like this:

<?php
require_once 'HTTP/Request2.php';

header("Content-type: text/plain");

define('BASE_URL', 'https://print.get-map.org/apis/v1/');

$data = ['umap_url' => 'https://umap.openstreetmap.fr/en/map/123/geojson/'];

$request = new HTTP_Request2(BASE_URL . "jobs");

$request->setMethod(HTTP_Request2::METHOD_POST)
        ->addPostParameter('job', json_encode($data));

$response = $request->send();
$status   = $response->getStatus();

if ($status < 200 || $status > 299) {
    print_r($response->getBody());
    exit;
}

$reply = json_decode($response->getBody());
echo "Result URL: ".$reply->interactive."\n";

UTM Grid Overlay (Experimental!)

Over the years there were requests for UTM support in my MapOSMatic instance every once in a while.

I now spent most of the first day of this years FOSSGIS Summer Camp on the topic, and I’m now happy to announce a first exeprimental implementation of an UTM grid overlay.

The screenshot shows the grid overlay only for clarity, it shows the grid for transition between two UTM zones, and the not-yet-perfect label placing:

If you are interested in further progress on this feature you may wat to subscribe to the Feature Request

Duplex layout with index on extra page

So far for the single page layouts the street index could only be rendered on the side or the bottom of the same page.

Now it is possible to have the index rendered on a second page in PDF output. So it is now possible to duplex print a map with the actual map on the front side and the street index on the back side of the same sheet of paper.

As the other output formats do not support multi page output there will no extra index page be generated for these. Choosing the “index on extra page” layout these formats will have the grid added to them again though, which can be used in combination with the generated street index file in CSV format.

Translation system

The original MapOSMatic project used Transifex as its web translation frontend.

As my fork diverged over time, and as Transifex became less open, I have been thinking about an alternative for quite a while now. So far none of the alternatives I’d been looking at really convinced me though.

Now yesterday I stumbled across Weblate, and almost fell in love immediately. Almost everything I ever wished for, supports self hosting, and is even easy to setup.

So translations can now be maintained on https://translate.get-map.org/projects/maposmatic/

The only thing from my wish list that’s still missing now is OpenStreetMap OAuth support, but as the project already supports other OAuth providers this should be easy to add over the next weekend, if not earlier.