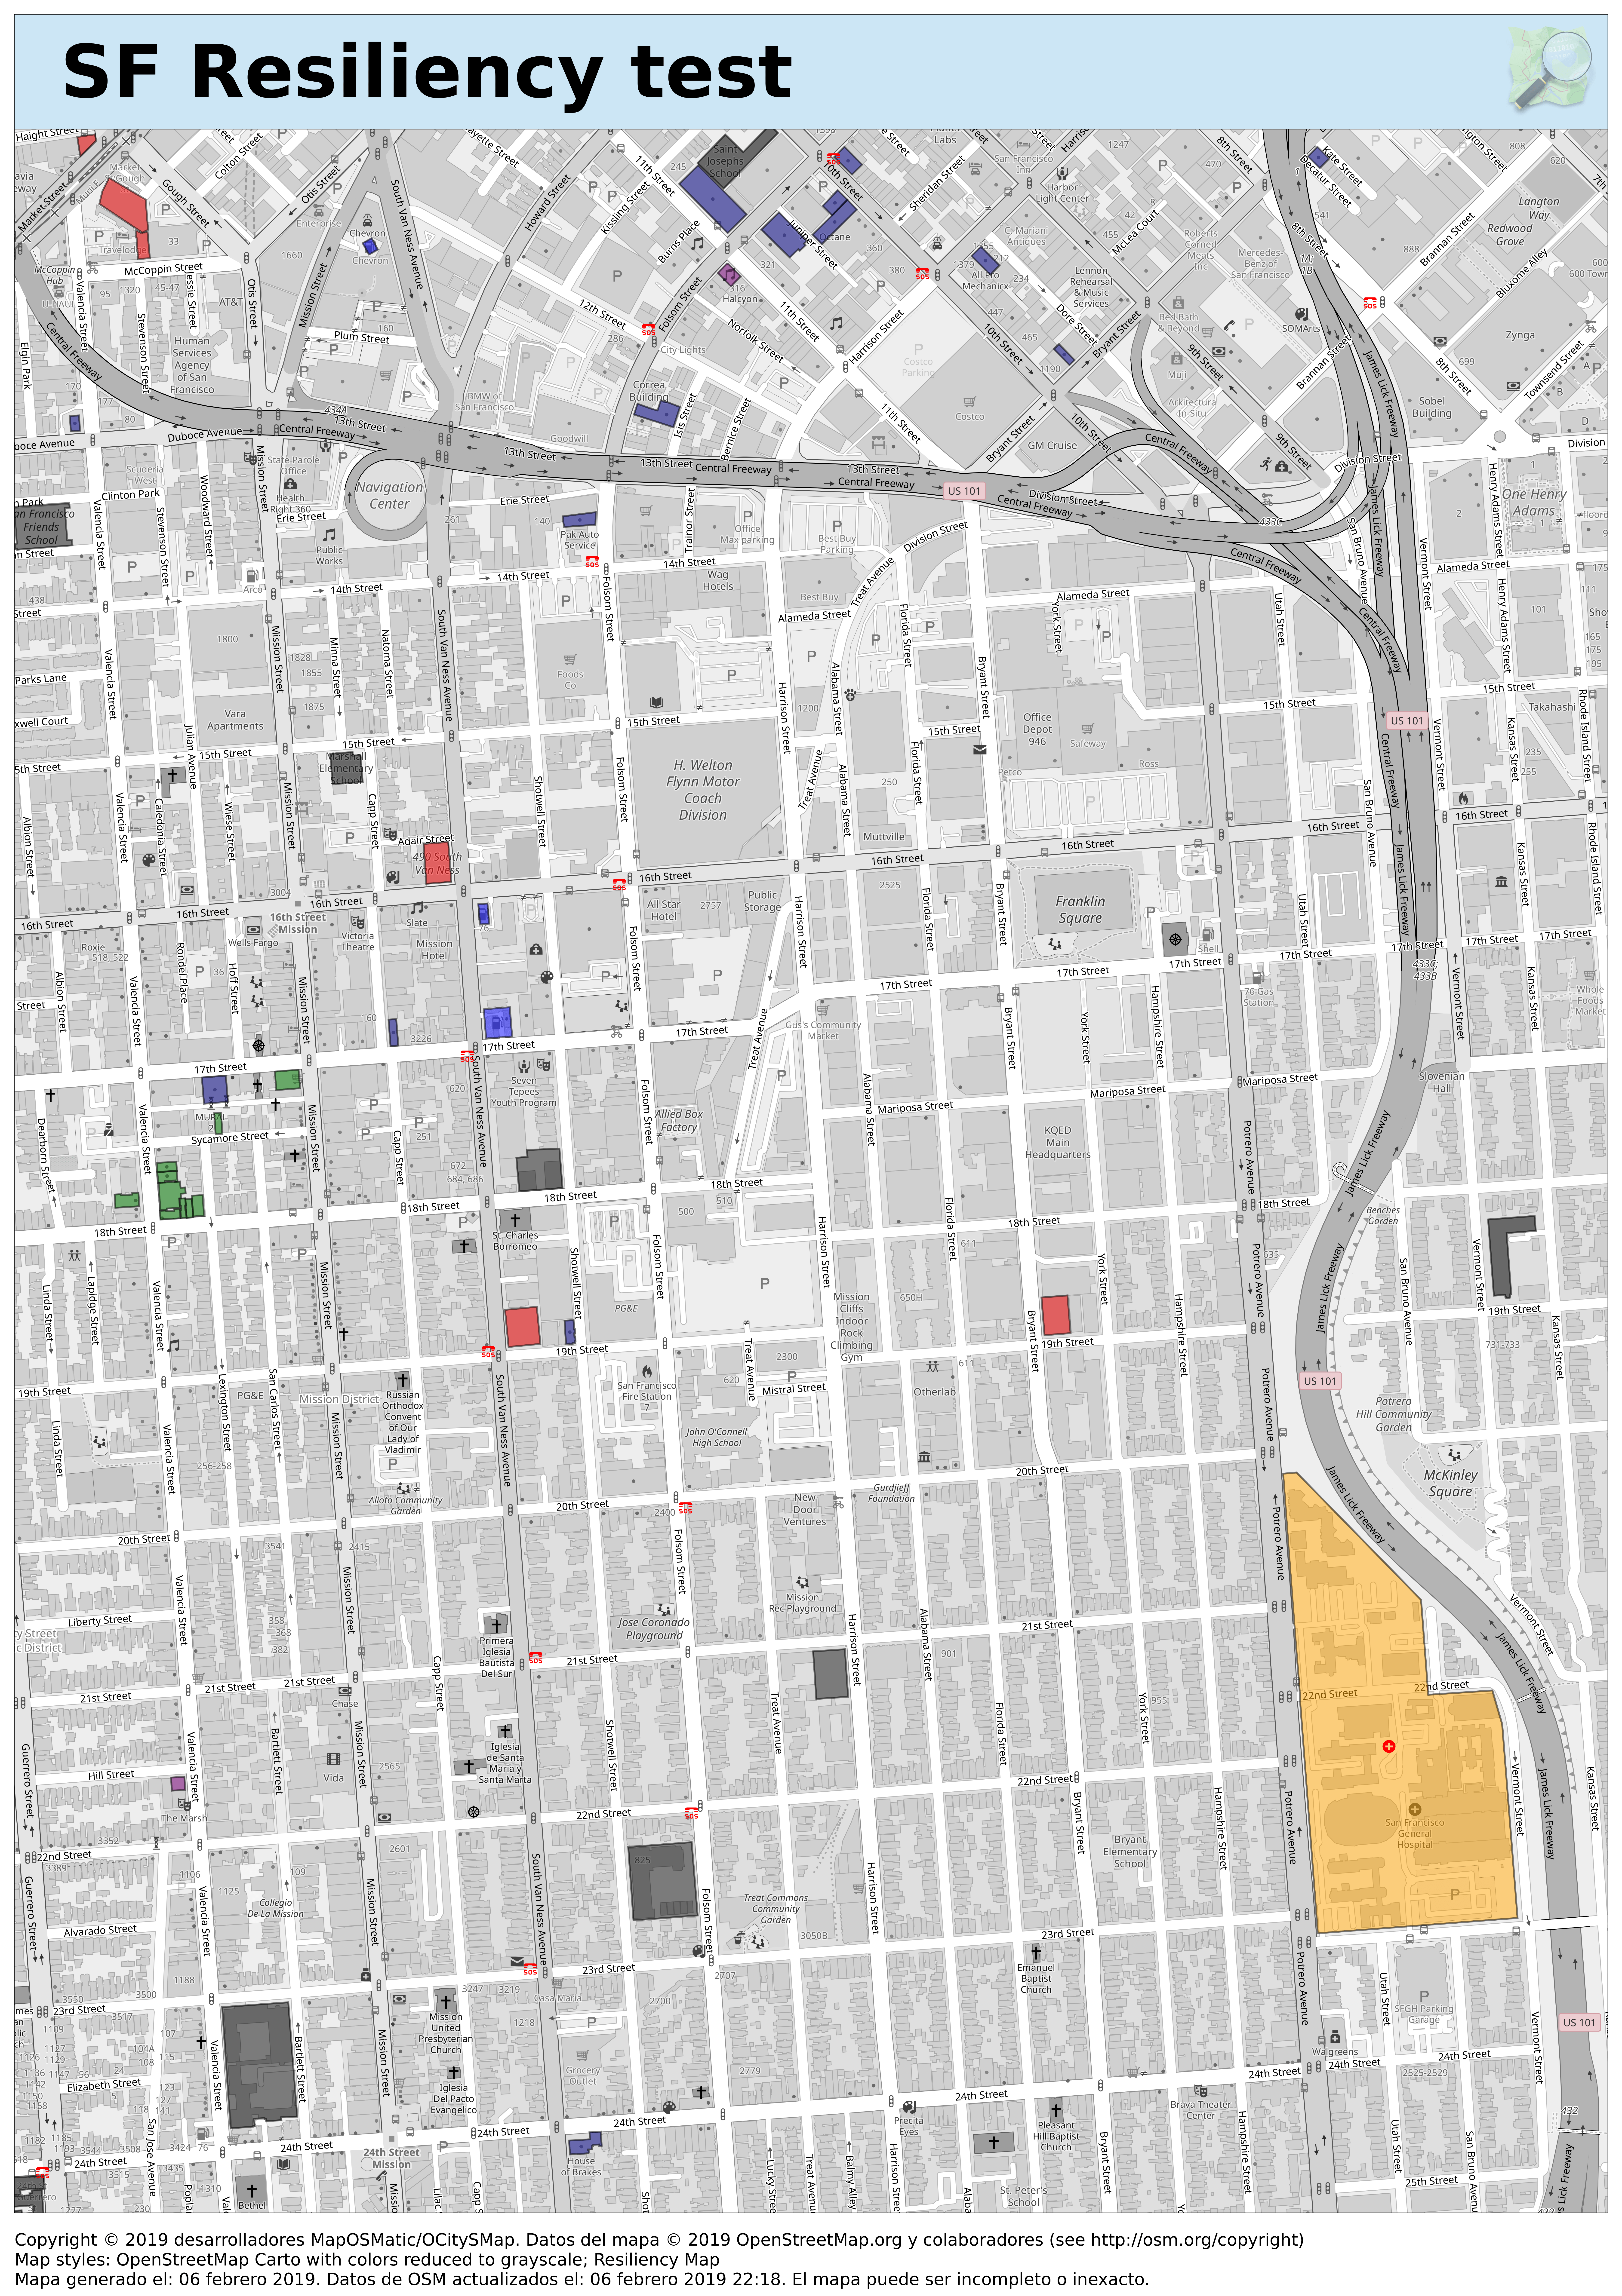
After listening to Stfano Maffulli’s great talk on OpenStreetMaps for emergency prep: The view from San Francisco I added a resiliency overlay style based on his QGis based prototype (page #14 in the slides).
The style can now be selected in the “Overlays” form step.
It is still “Work in Progress” though, with Source available on GitHub

That’s great – but how can I generate a map with a legend that will tell me what all those colourful polygons mean?
Right now there is no way to generate a legend for the created maps. Auto-generated legends / map keys are high on my todo list, but also not that simple to generate. I have no estimated release date for this at all yet.
For the resilience map style the color scheme is the same as in the presentation slide that this post refers too …