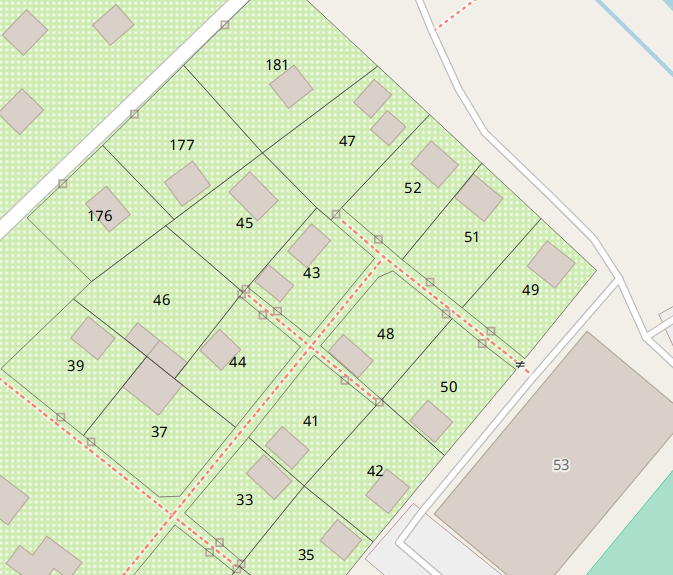
On special request during 35C3 I’ve added an “Allotment” style overlay that renders allotment plot borders and plot numbers:

A playground for OSM related stuff
On special request during 35C3 I’ve added an “Allotment” style overlay that renders allotment plot borders and plot numbers:

I actually added the ability to add a QR code on the map to the renderer backend quite a while ago, but up to now it was only accessible via a command line parameter when starting the renderer directly.
This has now changed, and the web interface now offers a new QR code effects overlay. For now the endoced text is fixed to the request URL of the rendered map itself, but as soon as I’ve finished my plans for allowing for input of extra overlay customization parameters the QR code content will be freely customizeable.

I’ve started to add some hyperlinks to the multipage PDF output, now that CairoGraphics and PyCairo support this.
For now only the “next page” arrows on the edges of the detail map pages are linked to the target pages in the PDF:

UPDATE: The page rectangles on the overview now link to the detail pages, too
In recent weeks I have exeprimented with some user interface improvements again. None of these really changed the workflow, so they should be rather intuitive. But I still think that they improve the user experience a little bit.
Last week this MapOSMatic instance processed its 40,000s map request, for a map of Sindelfingen, Germany.
While request numbers per day are fluctuating quite a bit there’s an obvious, but slow upwards trend, with typically over a hundred requests processed per day.
Fun fact: over the last year activity slowly shifted from peaks on weekends to higher activity on regular weekdays.
If you want to have a look for yourself: here are the Munin monitorign graphs